Sending Data to Elasticsearch
In this section we will add the components necessary to spin up a new Elasticsearch and Kibana (ELK) instance and have our collected data published to it in real time. You should have a Gather server running, have submitted some data to it and have Aether Connect running. If not, go to the previous section
Setting Up ELK
We’re going to use docker-compose to start the elasticsearch and Kibana servers as well as the Elasticsearch consumer. No configuration is required, it all should just work. In your terminal, navigate to the aether-bootstrap directory, and then modify the options.txt file:
## ElasticSearch
ENABLE_ELASTICSEARCH=true
Then run the script:
./scripts/init.sh
./scripts/start.sh
Once this has completed, open a new browser window, go to http://aether.local/{tenant}/kibana/kibana-app Kibana should load and you should see the Kibana welcome screen. Select “Explore my own” to explore the data already uploaded.

On the left side bar, select “Management” and then “Index patterns” and you should see:
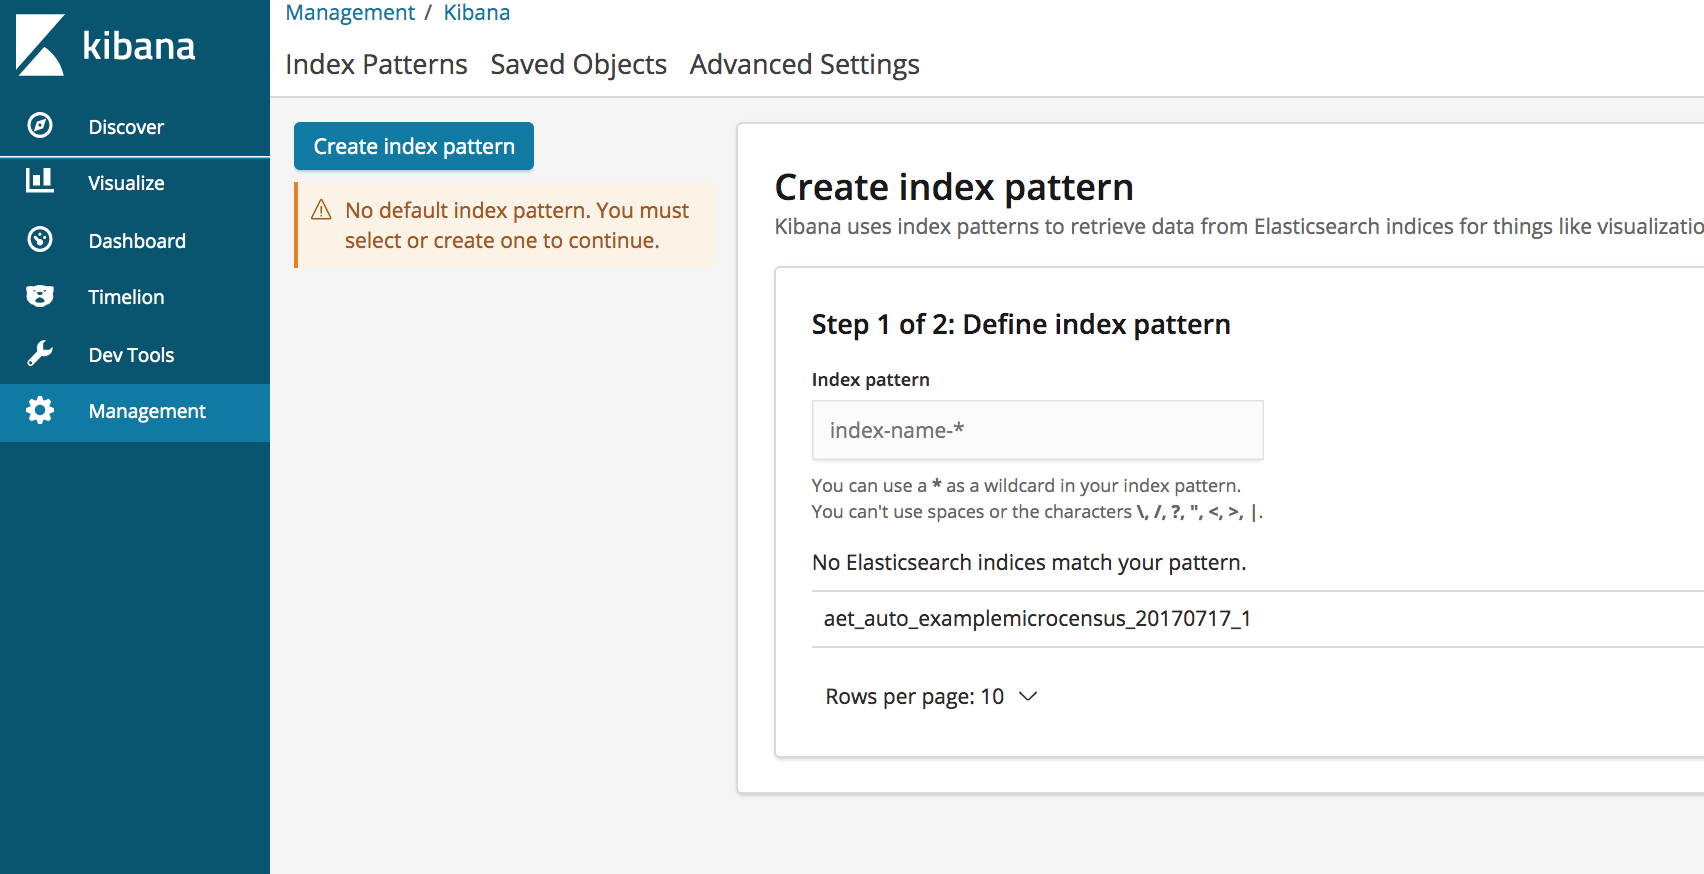
Index patterns tell Kibana which Elasticsearch indices you want to explore. An index pattern can match the name of a single index, or include a wildcard (*) to match multiple indices. At this point, you should see an Elasticsearch index named aet_auto_examplemicrocensus_20170717_1
Create a Kibana index pattern by using aet_auto_examplemicrocensus* then press > Next Step and then select end from the “Time Filter field name” dropdown. In Kibana, all data is related to, and can be filtered by, time fields. Having a default time field makes working with an index pattern much nicer. In this case, end is one of the fields sent by ODK Collect to indicate when the data collection for a survey ended. Complete the process by selecting Create index pattern.
Congratulations - we are now publishing the collected data to Elasticsearch and can visualize it in kibana!
View the Data in Kibana
On the left hand side, click on Discover and you will probably see a screen with the message “No results match your search criteria” This is likely due to Kibana’s default time range of last 15 minutes. In the upper right hand corner of the Kibana display, click the clock icon and change the time range to include whenever you sent the form data from ODK Collect. You should then see the JSON data submitted.
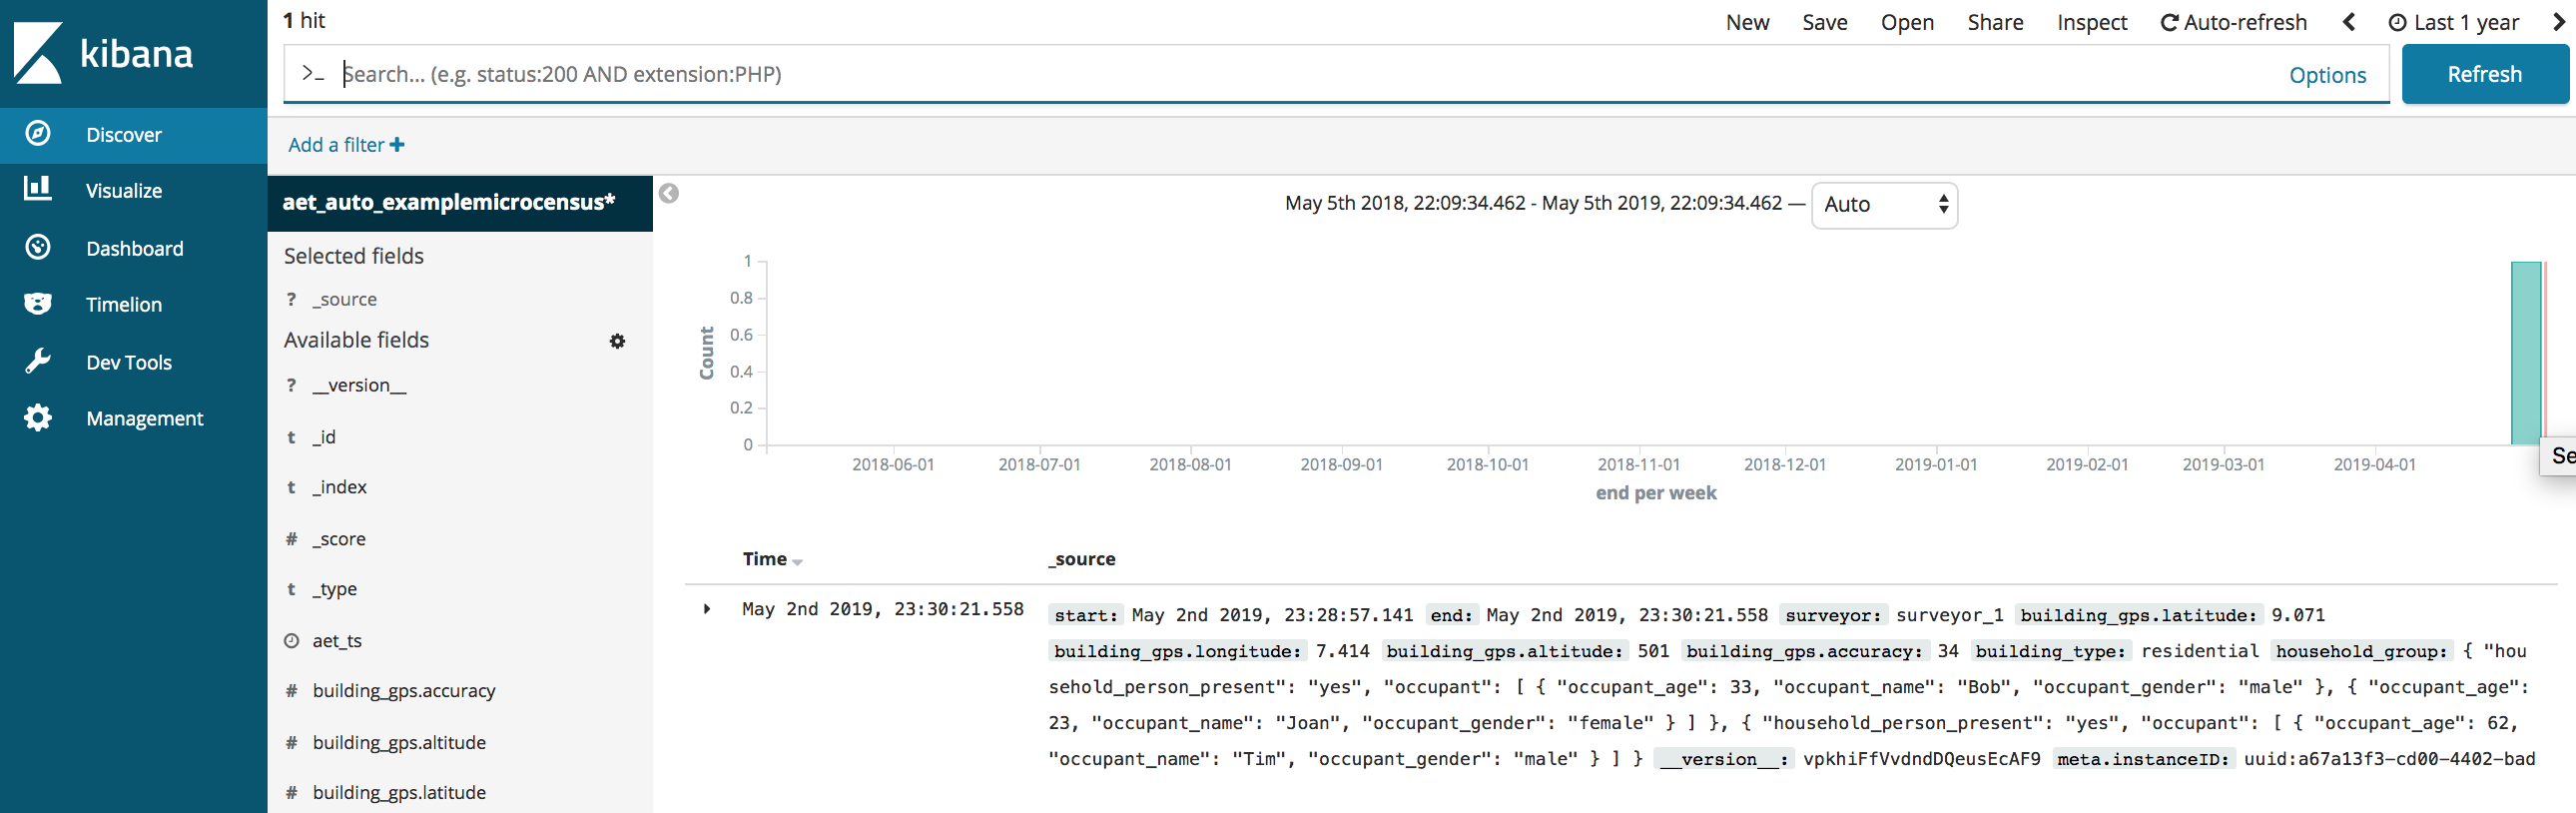
If you now fill in the example-microcensus form again in ODK Collect and submit it to Gather, the data will be automatically published and visible in Kibana.
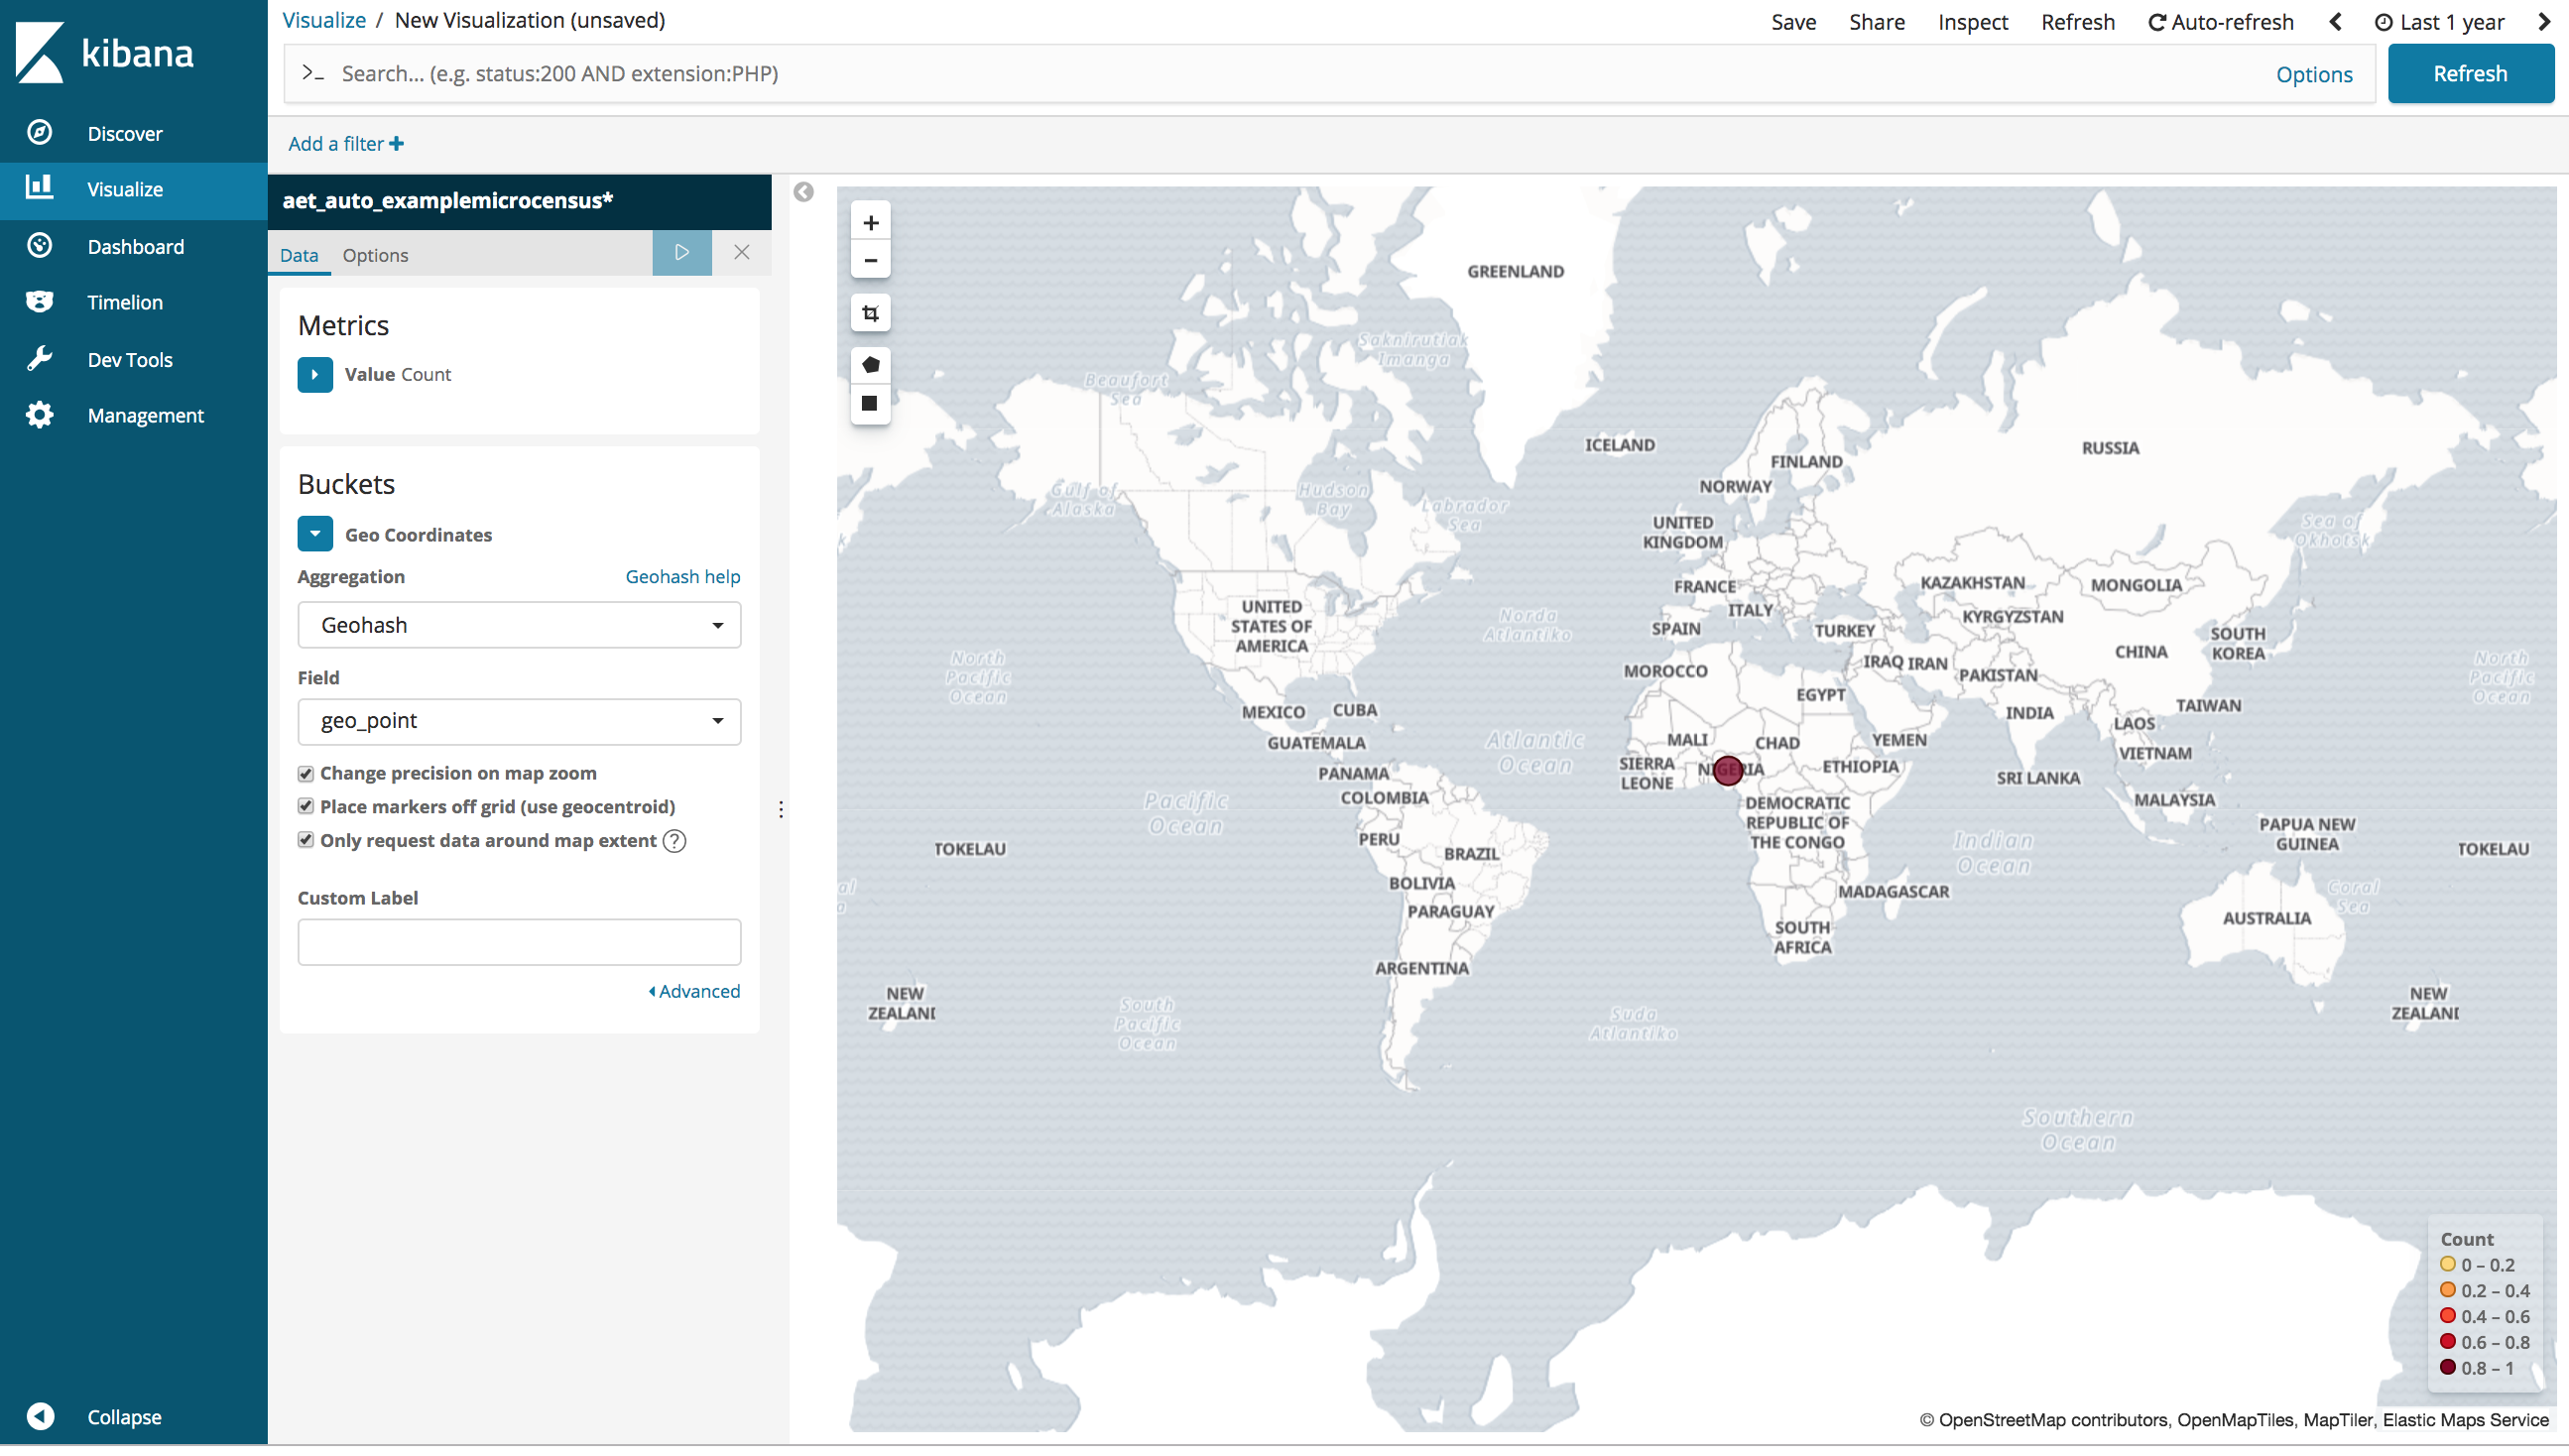
Try playing around with visualizations.
- Click
Visualizeon the left panel - Press the
Create a visualizationbutton - Under “Maps” select
Coordinate Map - Select
aet_auto_examplemicrocensus*as your index - Click on
Geo Coordinatesunder “Buckets” and “Select buckets type” - Click on
Geohashto select it as the aggregation type - Select
geo_pointwhere it says “Select a field” - Press the “run” icon (triangle “play button”) above and you should see your data plotted on a map
Recap
In this section we started a local ELK instance and then configured and deployed the Aether-Elasticsearch consumer that reads messages from the Kafka message queue and posts that data to Elasticsearch. We then viewed in Kibana the data that we collected earlier via ODK using the Discover mode and by creating a visualization.